
Why geographical maps lie: illusions, projections and the legacy of Mercator
For centuries, maps have shaped our understanding of the world. They appear objective, scientific, almost unquestionable. Yet maps lie — not out of malicious intent, but out of mathematical and geometric necessity. Representing a sphere on a flat surface inevitably creates distortions, geographic optical illusions, and sometimes genuine geometric deceptions with major cultural, political, and nautical consequences.
In this article intended for readers of Librairie Maritime Nautic Way, we explore why and how maps distort reality, with a particular focus on the projection of Gerardus Mercator, a cornerstone of modern maritime navigation. We will examine concrete examples, practical uses in navigation, and the limitations that must be understood to avoid misinterpretation.
1. Why Do Maps Lie?
1.1 The Earth Is Not Flat
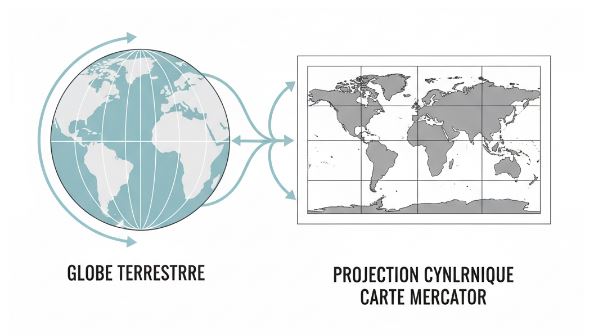
The first cause of cartographic deception is simple: the Earth is (almost) spherical. Any attempt to project a curved surface onto a flat plane inevitably results in distortions. These distortions may affect:
- distances
- areas
- angles
- shapes
No flat map can preserve all four properties simultaneously.
1.2 Geographic Optical Illusion
A geographic optical illusion occurs when our brain interprets a map as a faithful representation of reality. For example:
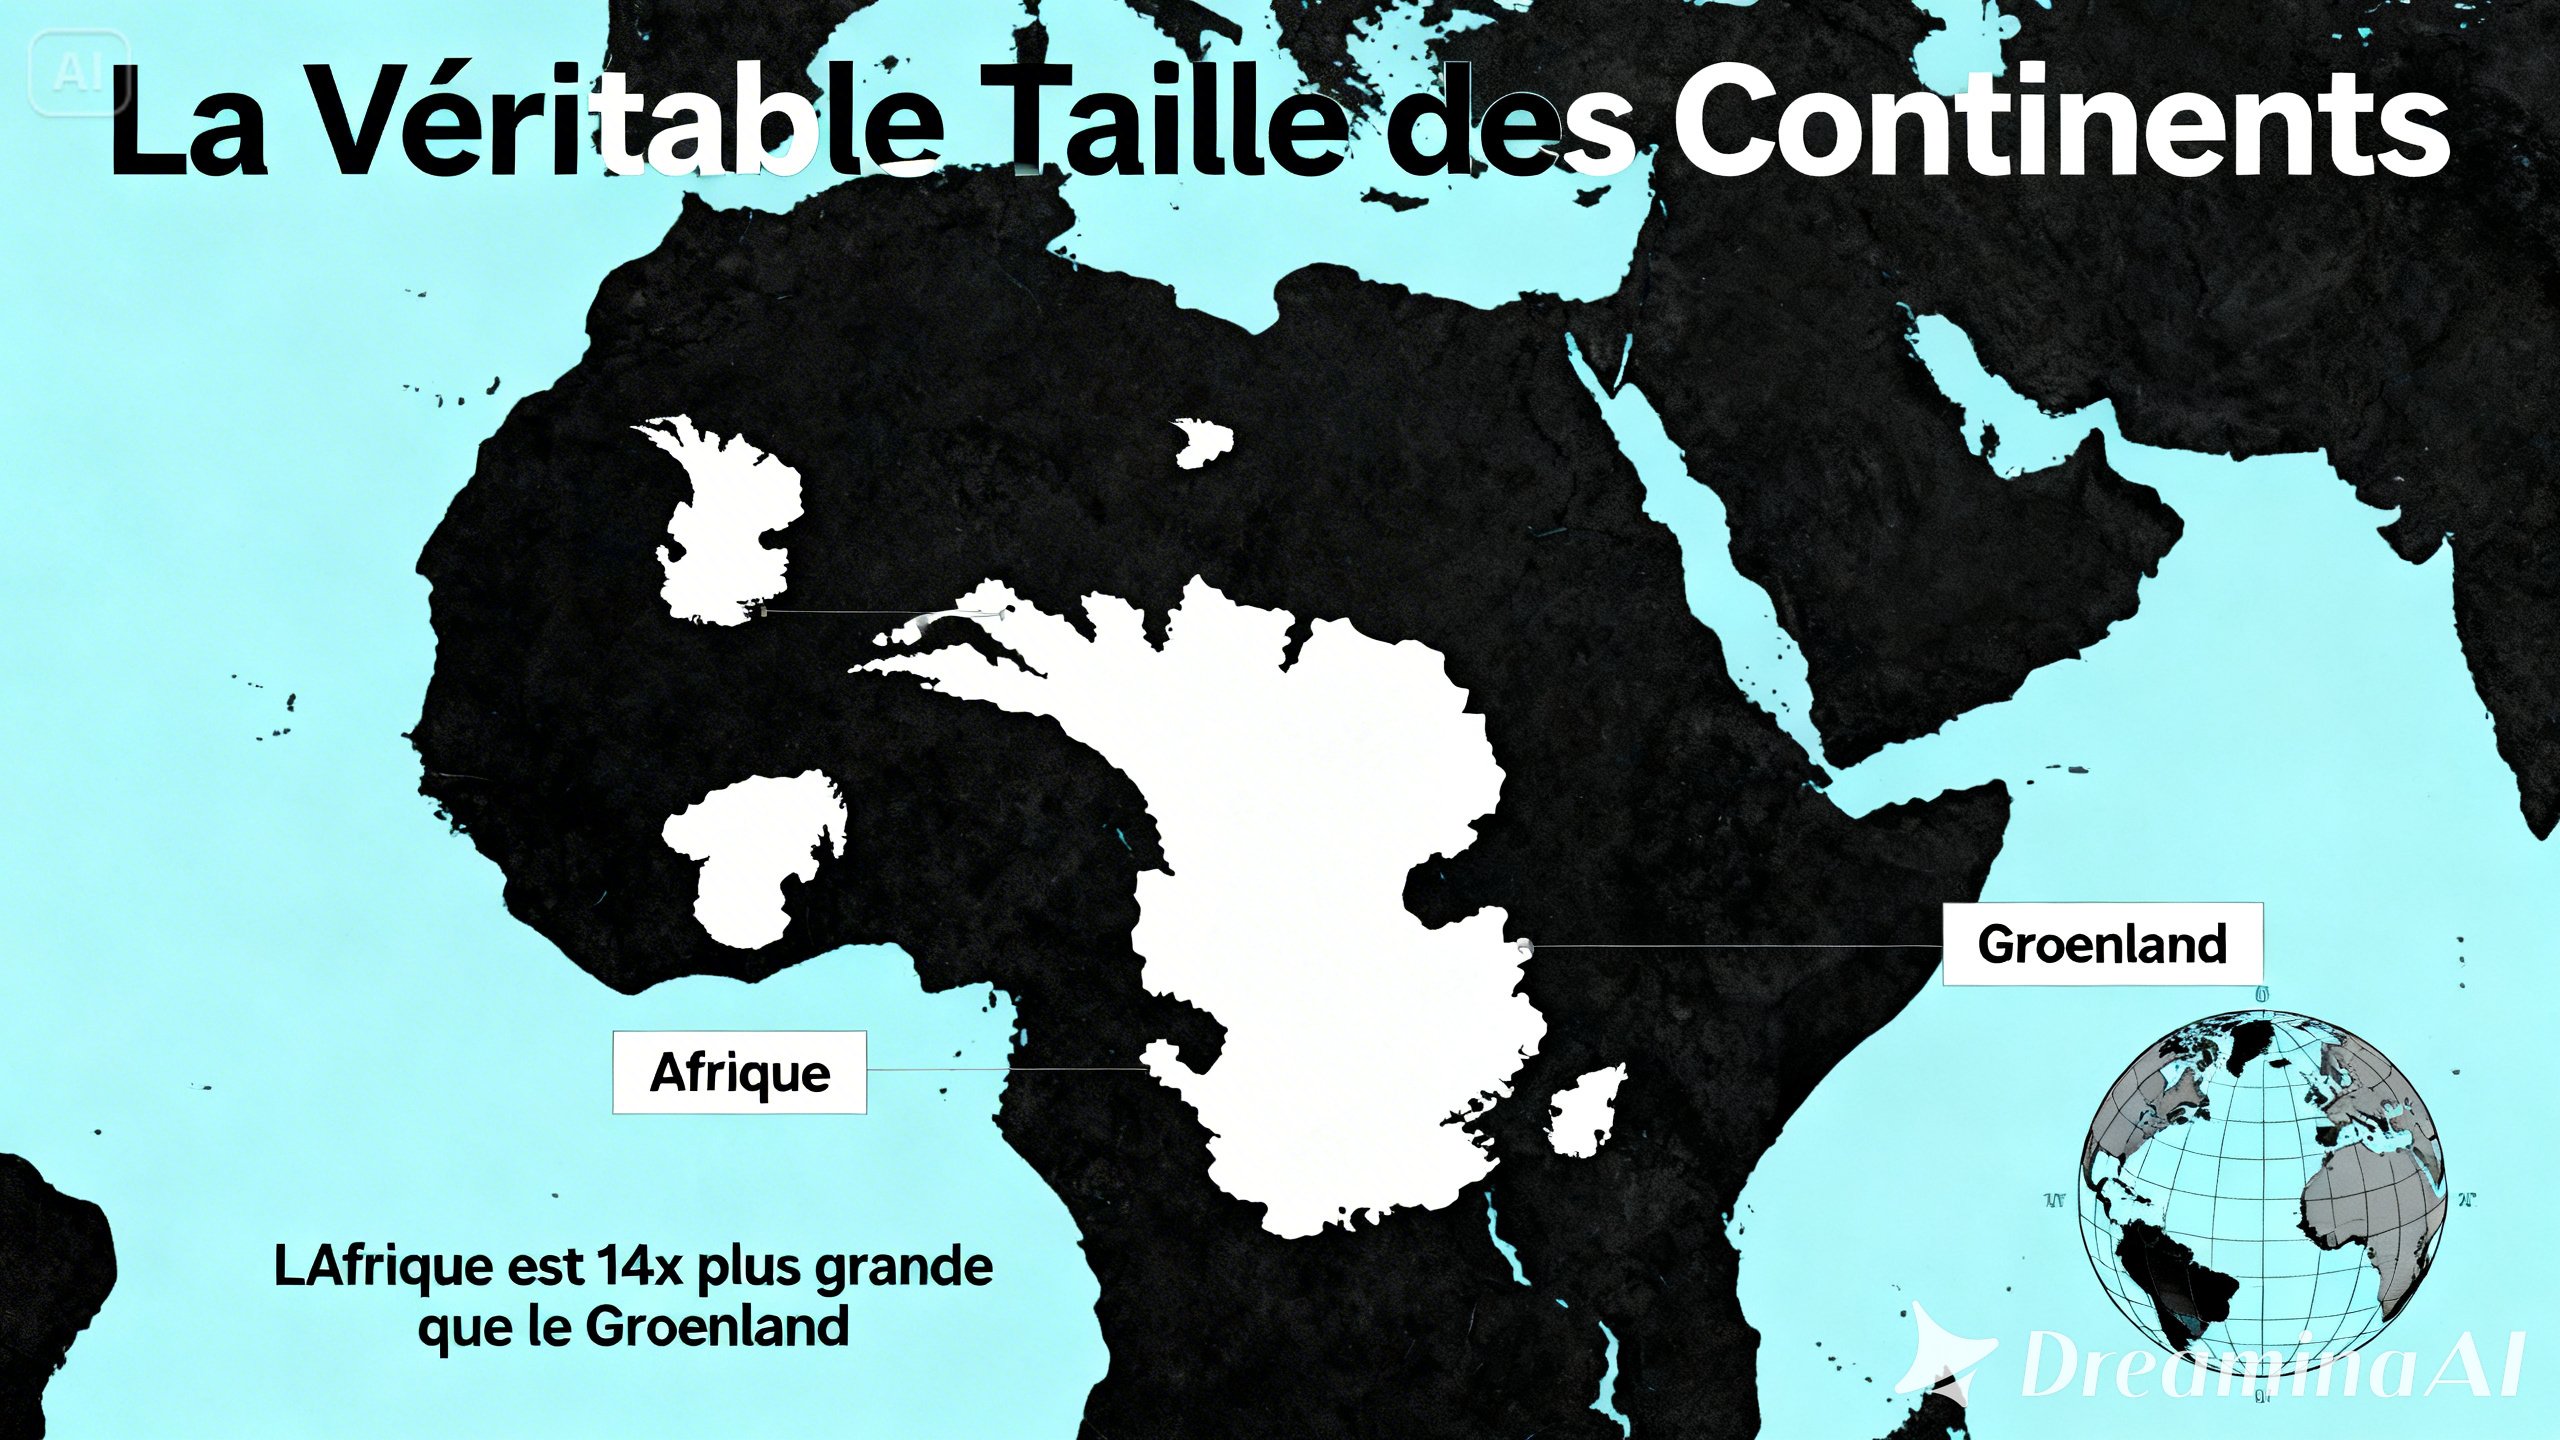
- Greenland appears as large as Africa on some maps, even though it is 14 times smaller.
- Europe seems central and dominant, while Africa and South America are visually minimized.
These illusions influence our perception of the world, of distances, and even of power relations.
2. Geometric Deception: A Mathematical Constraint
2.1 Projecting a Sphere onto a Plane
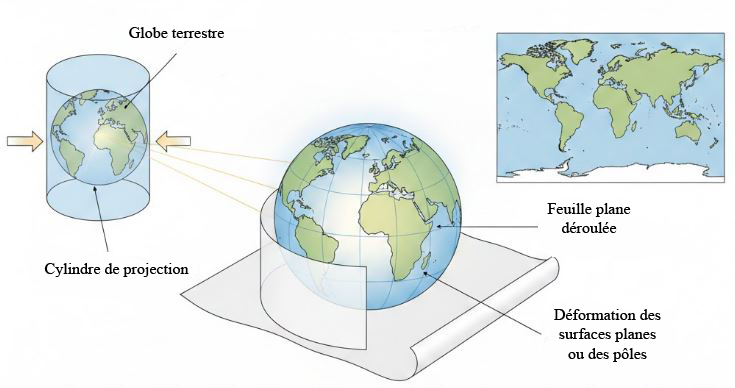
From a mathematical standpoint, it is impossible to project a sphere onto a plane without distortion. This is a fundamental theorem of differential geometry.
Every cartographic projection therefore makes a choice:
- preserving angles (conformal maps)
- preserving areas (equal-area maps)
- preserving distances (locally)
2.2 Lie or Compromise?
Speaking of “geometric deception” does not mean that cartographers intentionally mislead. Rather, it is an accepted compromise, often poorly explained to the general public.
In maritime navigation, some of these “lies” are even essential.
3. Gerardus Mercator: Genius or Impostor?
3.1 Who Was Gerardus Mercator?
Gerardus Mercator (1512–1594) was a Flemish geographer, cartographer, and mathematician. In 1569, he published a world projection designed specifically for navigators.
His goal: to facilitate dead reckoning and compass-based navigation.
3.2 The Mercator Projection Explained Simply
The Mercator projection is a conformal cylindrical projection. It preserves:
- angles
- directions (constant bearings)
But it strongly distorts:
- areas
- distances, especially at high latitudes
3.3 Why Mercator Is Essential in Navigation
On a Mercator chart:
- a loxodrome (constant-bearing route) appears as a straight line
- the navigator can plot a course with a compass and follow it without constant recalculation
This was a revolution in maritime navigation.
4. Concrete Examples of Cartographic Distortions
4.1 Greenland vs Africa
On a Mercator map:
- Greenland ≈ Africa (illusion)
In reality:
- Africa: ~30 million km²
- Greenland: ~2.1 million km²
4.2 Misleading Maritime Routes
A straight line between Europe and North America on a flat map is not the shortest route on the globe.
The orthodromic route (great circle) appears curved on a Mercator chart.
5. Practical Use in Maritime Navigation
5.1 When to Use a Mercator Chart
- Coastal navigation
- Constant-bearing route planning
- Rapid reading of alignments
5.2 When to Avoid Mercator
- Precise calculation of intercontinental distances
- Area comparison
- Geopolitical or educational analysis
5.3 Combining Paper Charts and Modern Tools
Today, navigators combine:
- paper charts (Mercator)
- GPS
- electronic charting (ENC)
Understanding cartographic illusions remains essential for correctly interpreting data.
6. Maps and Power: A Lasting Illusion
Maps have long served political narratives:
- enlarged Europe
- valorized Northern countries
- reduced Global South
The Mercator projection, though useful for navigation, reinforced certain worldviews.
7. Alternatives to Mercator
7.1 Peters Projection
- Areas preserved
- Shapes distorted
7.2 Mollweide Projection
- Good global overview
- Poorly suited to navigation
7.3 Why Mercator Remains Unavoidable at Sea
No other projection offers the same operational simplicity for mariners.
8. Reading a Nautical Chart Without Being Misled
8.1 Understanding Distortions Before Navigating
For both amateur and professional navigators, understanding that the map is not the territory is fundamental. A nautical chart is not a photograph of the world, but a working tool, built according to precise rules.
Before any use, it is recommended to:
- identify the projection used (most often Mercator)
- locate high latitudes, where distortions are strongest
- check the local scale, which varies with latitude
👉 In the Nautic Way selection, official SHOM nautical charts clearly state their projection and limits of use.
9. Distance Illusions and Common Navigation Errors
9.1 Measuring Distance on a Mercator Chart
On a Mercator chart, distance must be measured using the latitude scale, never the classic graphic scale.
Common mistake:
- measuring a distance at the equator and applying it to a higher latitude
Consequence:
- underestimation or overestimation of sailing time
10. Paper Charts vs Electronic Cartography
10.1 Do Electronic Charts Lie Too?
Yes. Electronic charts (ENCs, raster charts, navigation apps) rely on the same projections as paper charts.
The modern danger is no longer the map itself, but overconfidence in the screen.
Best practices:
- always cross-check GPS with paper charts
- maintain a critical reading of displays
- understand what the software shows… and what it hides
11. Cartographic Illusion in Maritime Education
11.1 Training the Mariner’s Eye
In navigation schools, the Mercator projection is often taught as a given, without fully explaining its psychological effects.
Training the mariner’s eye means teaching them:
- to recognize cartographic optical illusions
- to distinguish true course, course made good, and chart course
- to anticipate projection-related discrepancies
12. Maps, Power, and the Maritime Imagination
12.1 When the Map Shapes the Narrative
Large wall maps based on the Mercator projection shaped the European maritime imagination:
- oceans at the center
- dominant Northern continents
- emphasized colonial routes
These maps are not neutral: they tell a story of the world seen from the sea.
13. Modern Alternatives and Reasoned Use
13.1 Why Mercator Is Not Replaced in Navigation
Despite its flaws, Mercator remains:
- intuitive
- operational
- compatible with the compass
Alternative projections are excellent for:
- global analysis
- education
- geopolitics
But poorly suited to real ship handling.
14. Choosing the Right Charts and Navigation Books
14.1 Buying Advice – Librairie Maritime Nautic Way
To navigate with an understanding of cartographic illusions, prioritize:
- official nautical charts (SHOM, UKHO)
- annotated nautical atlases
- coastal and offshore navigation manuals
Nautic Way Selection:
- Paper nautical charts by area
- Maritime route atlases
- Celestial navigation manuals
- Cartography and projection reference books
Conclusion
Saying that maps lie is neither a rejection of cartography nor a gratuitous provocation. It is an invitation to understand the geographic optical illusion and the geometric deception inherent in any projection.
The legacy of Gerardus Mercator remains fundamental: without him, modern navigation would not exist in its current form. But using his maps without critical thinking can lead to serious errors.
Through nautical charts, atlases, and specialized works, Librairie Maritime Nautic Way supports navigators, teachers, and maritime enthusiasts toward an informed, controlled, and conscious cartography.